Email report about server resource usage based on sar command (crontab ready)
With this crontab-ready script you can check CPU/RAM/IO/Load/HDD usage with monthly averages (except for hard disk usage). Script is based on sar command – and sar is part of sysstat package – so if you dont have it installed – install it (on CentOS: yum install sysstat).
This script is some kind of quick resolution – in case you don’t use Nagios or similar monitoring solutions. Sysstat collect usage snapshots on every 10 minutes by default – but you can increase or decrease this value by changing crontab file: /etc/cron.d/sysstat.
Sar by default (on CentOS) collect information’s in last 30 days (in Ubuntu Server – 14 days) but you an also change this value in sysstat config file /etc/sysconfig/sysstat (line begin with HISTORY)
#!/bin/bash
#########################################################################################
# Description: Crontab-ready script for resource usage which will be sent to email
# Author: Kompjuteras.com, but you are free to change and use this script however you want
#
# Crontab example (for running at first day in the month):
# 00  01  1  *  *  /root/scripts/ResourceUsageReport.sh > /tmp/CronResourceUsage.log 2>&1
#
#########################################################################################

shopt -s expand_aliases           # In case of mail use some smtp variables
source /root/.bash_profile        # for crontab usage (if you run as a root)

###################################### VARIJABLE #########################################
# Server name in user-friendly format: SomeYourPrefix_HOSTNAME_IPADDRESS
# You can hadcode this value if you want (it will be used for email subject or body, like:
# SERVER_NAME=KOMPJUTERAS_PROD_SERVER
SERVER_NAME="TESTSERVER_$( echo `hostname -s` | tr [:lower:] [:upper:] ) - `ip addr | grep 'state UP' -A2 | grep 'inet ' | tail -n1 | awk '{print $2}' | cut -f1  -d'/'`"

# Who need to get this report on email?
MAIL_TO="moj@mejl.kom"

# Where will be temp logs - best option is /tmp folder
LOGFILE_PREFIX=/tmp/SAR

# Where are sar achive files? On CentOS is /var/log/sa/ on Ubuntu is /var/log/sysstat/
SAR_LOG_FILE_LOCATION="/var/log/sa"

# You you want report per day (very detailed report - day-minute based)
# Y for yes and N for N
DAYLY_BASED_REPORT=Y

# Do you want average values about resource usage check?
# WARNING: If you do restart of server - you will get 2 line for that day, average until restart
# and average at the end of day
# Y for yes and N for N
AVERAGES_USAGE_REPORT=Y
##########################################################################################

# Check: is sysstat installed. If not - then exit
if [ `hash sar 2>/dev/null  ; echo $?` -gt 0 ] ; then echo "Instalirajte sysstat program prvo, izlazim!" ; exit 1 ; fi
if [ `hash mail 2>/dev/null ; echo $?` -gt 0 ] ; then echo "Instalirajte mailx program prvo, izlazim!"   ; exit 1 ; fi

# Remove old logs
rm -f ${LOGFILE_PREFIX}_*.log
# Full log generating - if DAYLY_BASED_REPORT=Y you will get it in separate mail
for i in {01..30}
do
	if [ -f ${SAR_LOG_FILE_LOCATION}/sa${i} ] ; then
		echo "`sar -u -f ${SAR_LOG_FILE_LOCATION}/sa${i} ` | DayOfTheMonth ${i}" | grep -v `hostname` >> ${LOGFILE_PREFIX}_CPU.log
		echo "`sar -r -f ${SAR_LOG_FILE_LOCATION}/sa${i} ` | DayOfTheMonth ${i}" | grep -v `hostname` >> ${LOGFILE_PREFIX}_RAM.log
		echo "`sar -S -f ${SAR_LOG_FILE_LOCATION}/sa${i} ` | DayOfTheMonth ${i}" | grep -v `hostname` >> ${LOGFILE_PREFIX}_SWP.log
		echo "`sar -q -f ${SAR_LOG_FILE_LOCATION}/sa${i} ` | DayOfTheMonth ${i}" | grep -v `hostname` >> ${LOGFILE_PREFIX}_LOAD.log
		echo "`sar -b -f ${SAR_LOG_FILE_LOCATION}/sa${i} ` | DayOfTheMonth ${i}" | grep -v `hostname` >> ${LOGFILE_PREFIX}_IO.log
	fi
done

# Average usage log creation
	# CPU usage
	CPU_CORES=`cat /proc/cpuinfo | grep vendor_id | wc -l`
	echo "CPU Cores       : ${CPU_CORES}"                        > ${LOGFILE_PREFIX}_CPU_AVG.log
	cat /proc/cpuinfo | grep 'model name' | sort -u             >> ${LOGFILE_PREFIX}_CPU_AVG.log
	cat /proc/cpuinfo | grep 'cpu MHz'    | sort -u             >> ${LOGFILE_PREFIX}_CPU_AVG.log
	echo "-----------------------------"                        >> ${LOGFILE_PREFIX}_CPU_AVG.log
	echo "`sar -u | sed -n 3p` | Description"                   >> ${LOGFILE_PREFIX}_CPU_AVG.log
	cat ${LOGFILE_PREFIX}_CPU.log | grep 'Average:'             >> ${LOGFILE_PREFIX}_CPU_AVG.log
	# RAM usage
	echo "-----------------------------"                         > ${LOGFILE_PREFIX}_RAM_AVG.log
	cat /proc/meminfo | grep 'MemTotal'  | sort -u              >> ${LOGFILE_PREFIX}_RAM_AVG.log
	cat /proc/meminfo | grep 'SwapTotal' | sort -u              >> ${LOGFILE_PREFIX}_RAM_AVG.log
	echo "-----------------------------"                        >> ${LOGFILE_PREFIX}_RAM_AVG.log
	echo "`sar -r | sed -n 3p` | Description"                   >> ${LOGFILE_PREFIX}_RAM_AVG.log
	cat ${LOGFILE_PREFIX}_RAM.log    | grep 'Average:'          >> ${LOGFILE_PREFIX}_RAM_AVG.log
	# SWAP usage
	echo "-----------------------------"                         > ${LOGFILE_PREFIX}_SWP_AVG.log
	cat /proc/meminfo | grep 'SwapTotal' | sort -u              >> ${LOGFILE_PREFIX}_SWP_AVG.log
	echo "-----------------------------"                        >> ${LOGFILE_PREFIX}_SWP_AVG.log
	echo "`sar -S | sed -n 3p` | Description"                   >> ${LOGFILE_PREFIX}_SWP_AVG.log
	cat ${LOGFILE_PREFIX}_SWP.log    | grep 'Average:'          >> ${LOGFILE_PREFIX}_SWP_AVG.log
	# Server LOAD
	echo "-----------------------------"                         > ${LOGFILE_PREFIX}_LOAD_AVG.log
	echo "CPU Cores       : ${CPU_CORES}"                       >> ${LOGFILE_PREFIX}_LOAD_AVG.log
	echo "-----------------------------"                        >> ${LOGFILE_PREFIX}_LOAD_AVG.log
	echo "`sar -q | sed -n 3p` | Description"                   >> ${LOGFILE_PREFIX}_LOAD_AVG.log
	cat ${LOGFILE_PREFIX}_LOAD.log | grep 'Average:'            >> ${LOGFILE_PREFIX}_LOAD_AVG.log
	# Disk usage
	echo "------------------------------------------------"      > ${LOGFILE_PREFIX}_HDD.log
	df -Ph | grep -v tmpfs                                      >> ${LOGFILE_PREFIX}_HDD.log
	echo "------------------------------------------------"     >> ${LOGFILE_PREFIX}_HDD.log
	# I/O activity
	echo "-----------------------------"                         > ${LOGFILE_PREFIX}_IO_AVG.log
	echo "I/O activity on server"                               >> ${LOGFILE_PREFIX}_IO_AVG.log
	echo "-----------------------------"                        >> ${LOGFILE_PREFIX}_IO_AVG.log
	echo "`sar -b | sed -n 3p` | Description"                   >> ${LOGFILE_PREFIX}_IO_AVG.log
	cat ${LOGFILE_PREFIX}_IO.log | grep 'Average:'              >> ${LOGFILE_PREFIX}_IO_AVG.log

# If you put AVERAGES_USAGE_REPORT=Y you will get this email
if [ ${AVERAGES_USAGE_REPORT} == "Y" ] ; then
echo "Prosecne vrednosti su u prilogu" | mail -s "${SERVER_NAME} - Average usage report for 30 days" \
-a ${LOGFILE_PREFIX}_CPU_AVG.log  \
-a ${LOGFILE_PREFIX}_RAM_AVG.log  \
-a ${LOGFILE_PREFIX}_SWP_AVG.log  \
-a ${LOGFILE_PREFIX}_LOAD_AVG.log \
-a ${LOGFILE_PREFIX}_IO_AVG.log   \
-a ${LOGFILE_PREFIX}_HDD.log      \
${MAIL_TO}
fi
# If you put DAYLY_BASED_REPORT=Y you will get this email
if [ ${DAYLY_BASED_REPORT} == "Y" ] ; then
echo "Puna statistika je u prilogu"    | mail -s "${SERVER_NAME} - Daily usage report for 30 days" \
-a ${LOGFILE_PREFIX}_CPU.log  \
-a ${LOGFILE_PREFIX}_RAM.log  \
-a ${LOGFILE_PREFIX}_SWP.log  \
-a ${LOGFILE_PREFIX}_LOAD.log \
-a ${LOGFILE_PREFIX}_IO.log   \
-a ${LOGFILE_PREFIX}_HDD.log  \
${MAIL_TO}
fi

exit 0
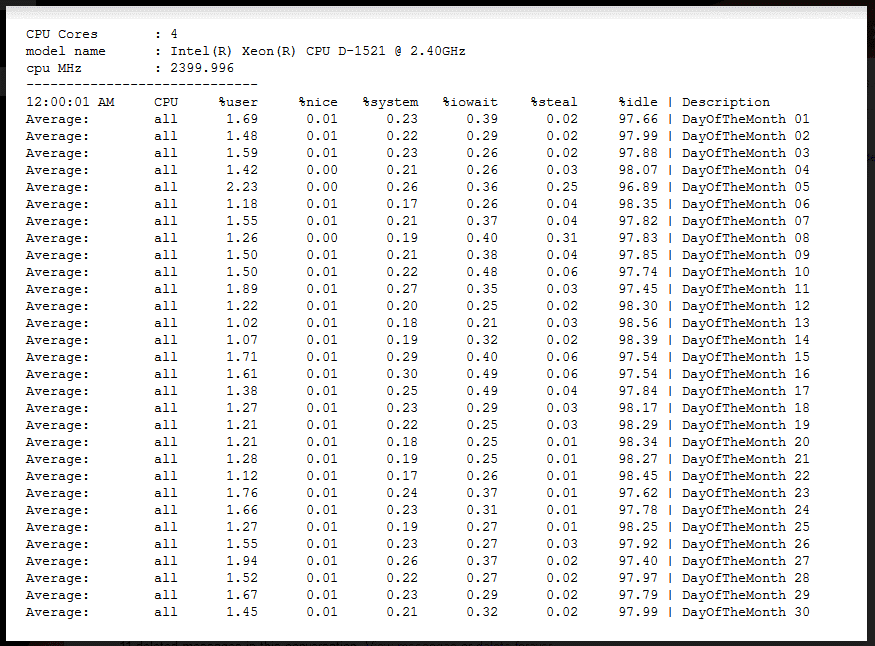
Here is example of CPU average usage report which you can get to email with this script